RawVision - Chromatography Analysis Tool
Installer Download (Windows)
Portable/Zip Download (Windows)
Software User Guide
The RawVision Chromatography Tool comes with two programs, RVMS for mass spectrometry analysis and RVPDA for photodiode array detector analysis. The tool can be used to analyze “.raw” files that are produced by Thermo Scientific liquid chromatograph (LC) instruments.
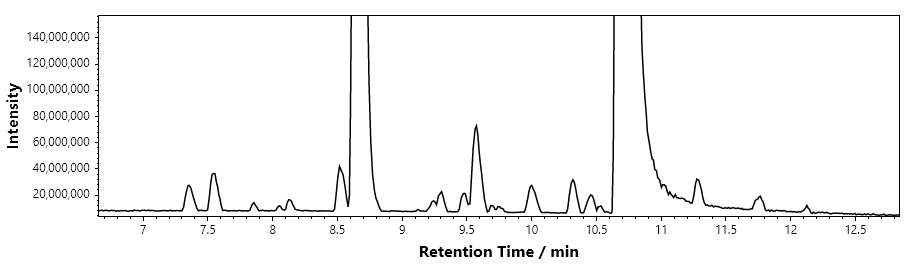
The two programs share a similar layout, with a chromatogram as the top figure and individual spectra displayed in the bottom figure. Interacting with the chromatogram figure will update which spectrum is being shown below. These figures can then be saved for quick reference later.
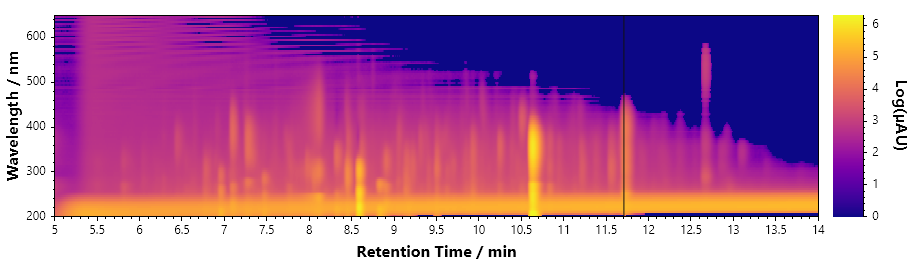
At its core, these program are meant to provide a simple way of extracting the data from “raw” data files into a format that can be plugged into custom scripts, Excel sheets, or Igor Pro experiments, helping users to take better control of their analysis. The feature of highlight is the creation of the Chromatogram Maps, which puts both the time and mass/wavlength axes on one figure and use color to visualize the change of intensity of certain spectral features over time. The ability to export the data behind these maps is what makes RawVision unique.
Some examples of figures made in RawVision are shown below.
RawVision MS Chromatogram
RawVision PDA Map Chromatogram